Project Management Graphs: 8 Charts Every PM Should Read
Learn the 8 essential project management graphs, what each one shows, and how to read them to spot delays, bottlenecks, and workload risks early.
When did you last open a project chart and learn something you didn't already know from the task list?
Many teams can't answer that. The Gantt chart stays open because a client expects it, the burndown survives because the sprint template came with one, and nobody reads either. The charts aren't the problem. The reading is.
Every project management graph answers a different question. A schedule tells you when work lands and what pushes it later. A flow view tells you where work is piling up. A workload view tells you who is over capacity before they burn out. Match the chart to the decision in front of you and the same picture that felt like decoration becomes the most useful thing in the room.
The eight graphs below are the ones worth knowing, and each one is framed around a reading skill: what healthy looks like, what a warning signal looks like, and what to do when you spot one. Interpretation is the part most guides skip.
Start with the chart nearly every client asks for.
1. Gantt Chart
A Gantt chart turns tasks into horizontal bars set against a time scale. Each bar carries a start date and a duration, and dependency lines show which tasks must finish before others can begin. It answers one question better than any other view: what sequence gets us to the delivery date, and which slip moves it.
The format is older than the software that draws it. Henry Gantt popularized his bar chart in roughly 1910 to 1915, while Karol Adamiecki had built a comparable scheduling method called the harmonogram back in 1896, though publishing mainly in Russian and Polish limited its international reach, as a history of project management records. U.S. production and logistics planning adopted Gantt charts after 1917, and the underlying structure has barely changed in a century.
It's still the default for good reason. In a survey of more than 600 project management professionals published in the 2022 Global Trends in Project Management report, 36% named the Gantt chart their preferred project format, ahead of task lists at 21%, Kanban boards at 16% and spreadsheets at 15%, and more than 60% said they use Gantt charts on 50% to 100% of their projects.
A schedule sketched by hand still shows the shape of the work better than most software screens. 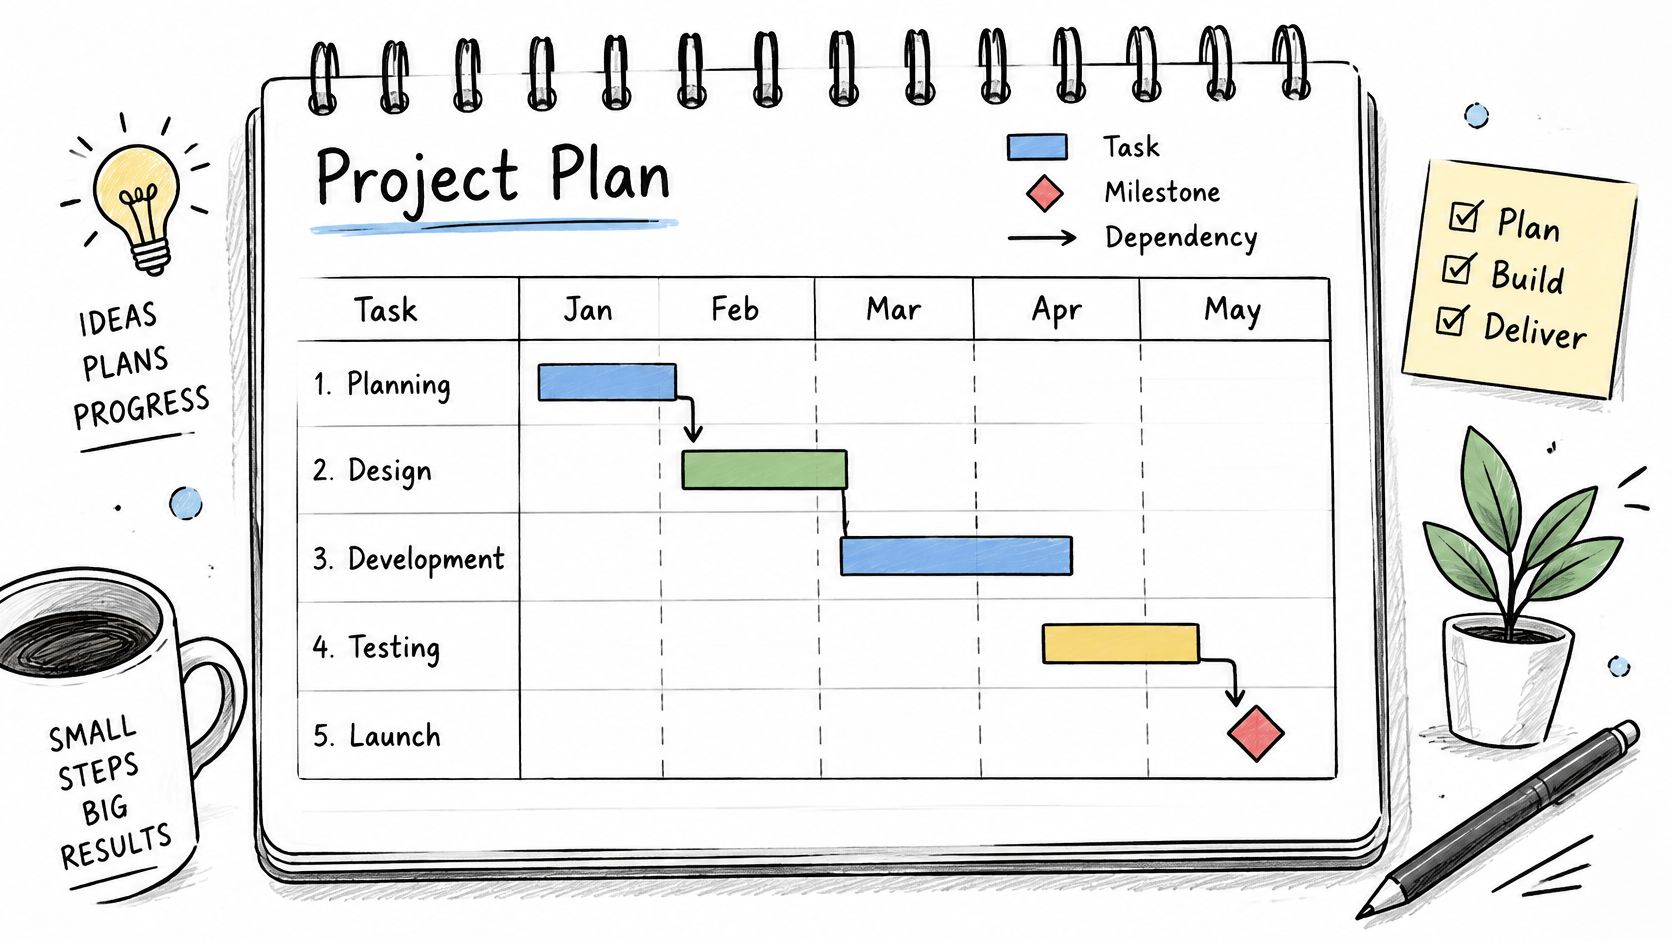
Reading the bars
- Healthy: five to ten top-level phases, a named owner behind every bar, milestones marking client reviews and approvals, and a baseline you can still measure variance against.
- Warning: every bar the same length and color because the plan came from a template, dependency lines crossing the whole chart, and nothing that has moved since kickoff. A schedule nobody updates isn't a plan, it's a wish.
Practical rule: If one bar slips and no other bar moves, your dependencies are decoration. Fix the links before you send the update.
Rebaseline when scope changes so variance stays honest, and keep the detailed task list with owners and due dates behind the chart. A worked layout for how to structure an example project plan shows how phases, milestones and approval gates sit together on one timeline.
2. Kanban Board
A Kanban board answers a sharper question than the schedule does: not when will this finish, but where is it stuck right now. Cards move left to right through columns that represent workflow stages, so the board shows flow instead of forecast. That makes it the wrong tool for a fixed deadline and the right one for steady delivery.
The reading skill here is spotting where cards accumulate. Columns are not storage.
What a healthy board shows
- Healthy: columns with written entry and exit criteria, work in progress limits on the review or approval column where items usually wait, and cards that mention owners and comments rather than sitting silent.
- Warning: one column holding most of the cards (nearly always "In Progress" or "Waiting for client"), columns named after people instead of stages, and cards older than two weeks with no comment on them.
Say a creative studio runs a design request board from brief to client approval. Twenty-two cards are open and fourteen of them sit in "Awaiting approval." The design team looks overloaded and isn't. The constraint is the client review loop, and no amount of design capacity fixes it. The fix is a scheduled review slot and a reminder that fires on day three of waiting, not another designer.
A board with no WIP limit is a task list with extra steps. The limit is what turns it into a diagnostic tool.
Set the limits where work queues, usually review and approval, and hold a short weekly pass to clear blocked cards. Group by client when you run several engagements at once, so a stuck card in one account doesn't hide behind a healthy board in another.
3. Burndown Chart
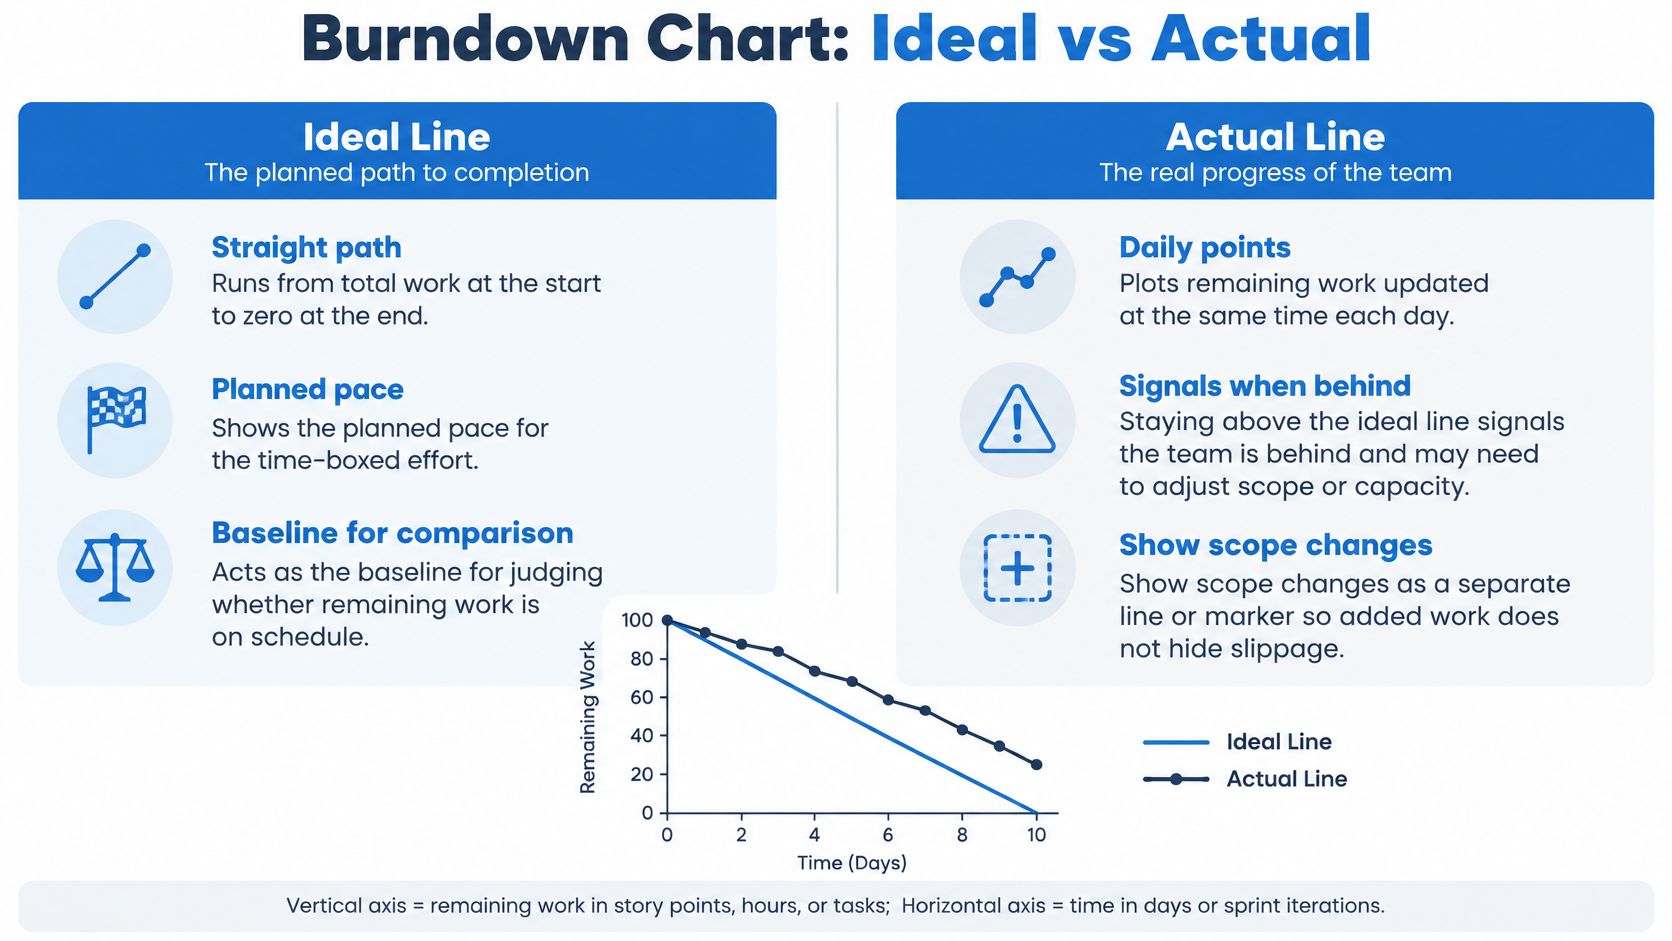
A burndown chart plots remaining work against time across a sprint or release. An ideal line runs from total work at the start down to zero at the end, and the actual line shows what's left each day. It's the fastest early warning you have on whether a time-boxed effort finishes.
Chart availability doesn't guarantee anyone reads the thing. In Capterra's 2021 survey of 422 U.S. project managers, Gantt and burndown charts appeared at once among the most used, most desired and most ignored project management software capabilities. The tool was there. The habit wasn't.
When the line is lying
- Healthy: the actual line runs close to and above the ideal line, the gap narrows steadily, and the chart is updated at the same time every day.
- Warning: a flat line for four days followed by a cliff at sprint end. That drop isn't velocity, it's bulk-closing tickets that weren't finished. The other red flag is a chart that resets scope mid-sprint without anyone recording it.
Track scope changes as their own line so slippage can't hide inside a shrinking backlog. Log hours against tasks when your estimates are in hours, because a burndown built on guessed point values drifts from reality fast. Review it at standup and act the same day, not at the retro. The project manager reports you send upward should carry the same numbers the team saw, or you'll spend the review explaining two different versions of the sprint.
4. Burnup Chart
If your scope moves more than your work does, burndown hides the story and burnup tells it. A burnup chart plots completed work rising against a separate scope line showing total work. Both lines are visible at once, which means a scope change cannot reset the finish line without being seen.
Take a four-month client engagement where change requests arrive monthly. On a burndown, each addition looks like the team suddenly slowed down. On a burnup, the completed line keeps climbing at a steady rate while the scope line steps upward. Same work, completely different conversation.
Separating delivery from scope
- Healthy: a completed line rising steadily, a scope line that is flat or steps up occasionally with a dated reason attached, and a forecast shown as a range rather than a single date.
- Warning: scope stepping up every single week while completed work stays flat. That's not a delivery problem, it's a scope problem, and pushing the team harder makes it worse.
Record every scope change with its date and cause so the line is explainable when a client asks. Keep the unit of work consistent, because mixing story points with hours turns a readable trend into noise. Share the chart with clients directly; it turns an awkward scope discussion into evidence anyone can follow.
5. Cumulative Flow Diagram
A cumulative flow diagram stacks work items by workflow stage over time, so each band's width shows how much work is sitting in that stage on any given day. It's the only chart here that shows process health as a shape. You read it by looking at where the bands swell.
Reading the bands
- Healthy: parallel bands of roughly constant width, a total height that stays stable, and each stage moving work through at a similar rate.
- Warning: one band widening week after week. That's a queue forming, and the stage above it is your constraint. Total height climbing means work in progress is growing faster than work is finishing.
Consider a studio tracking production requests through briefing, production and client approval. Over three weeks the approval band doubles in width while production stays flat. Production isn't slow. Approvals are, and every extra request piles up behind that step. The action is a named approver per request and a firm review window, not a push on production.
Read the diagram from the constriction, not from the top. The band that widens is the conversation you need to have this week.
Keep stage names and definitions stable or the bands stop being comparable. Review the diagram monthly for long-term trends and pair it with work in progress limits, since a limit that never changes the band widths isn't doing anything. A stage that narrows to nothing is also worth a look: it usually means work is skipping a step rather than flowing faster.
6. PERT and Critical Path Network Diagram
Network diagrams exist because bar charts hide the logic underneath the dates. The Critical Path Method was developed in 1957 by DuPont and Remington Rand for industrial project planning, and in 1958 the U.S. Navy and its partners built PERT for the Polaris missile program, using optimistic, most likely and pessimistic estimates instead of one fixed duration, as an introduction to project management sets out. Adoption stuck: one reported survey found 33.5% of firms using operations-research techniques used PERT, while 32.4% used CPM.
The critical path is the longest chain of dependent activities, and it sets the earliest possible finish. Anything on that chain slipping pushes the whole project. Everything else has float.
What the network tells you
- Healthy: a critical path that covers a minority of activities, three-point estimates with their assumptions written down, and float visible on the tasks that have room.
- Warning: everything flagged as critical. That usually means nobody estimated float and the tool defaulted to worst case. The second signal is a path that hasn't been recalculated since the last delay.
Monitor the critical path most closely, and recalculate it whenever a delay appears, because the path shifts to a different chain once one link stretches. Link every network activity to an owner so slippage surfaces as a name and a date rather than a line on a diagram.
7. Resource Workload Histogram
Capacity problems look fine on every other chart. A workload histogram plots assigned hours or tasks per person by week, so you can see overallocation and idle time in the same view. It's the chart that catches the problem before it becomes a resignation.
Real-time data is where many teams fall down. In 2025, 48.5% of organizations reportedly lacked access to real-time key performance indicators, a figure Proteus cites from Wellingtone in its State of Project Management 2025 report. A histogram built from last month's allocations will confidently point at the wrong person.
Reading the columns
- Healthy: most columns at or just under capacity, a little deliberate slack each week, and planned hours tracking close to logged hours.
- Warning: the same name pegged at full capacity for a quarter, columns that are perfectly full every week (a sign of padded estimates or no room for unplanned work), and a wide gap between planned and logged hours on the same person.
An agency running two designers and an account manager across three client projects is the classic case. Two designers show 45 hours in week three while the account manager shows 12. Reassign one deliverable before the week starts, not after the deadline passes.
Rebalance rule: Subtract meetings and admin from capacity first. A 40-hour column is a 30-hour person.
Compare planned against logged hours weekly, and review the histogram every Monday so you move work while it can still move.
8. Project Roadmap Timeline
The roadmap answers the question clients and executives ask: what do I get, and when? It shows major goals, phases and milestones across months or quarters, with outcomes rather than every task. That makes it a communication instrument, not a planning one.
A roadmap is only credible if it clears the capacity line behind it. 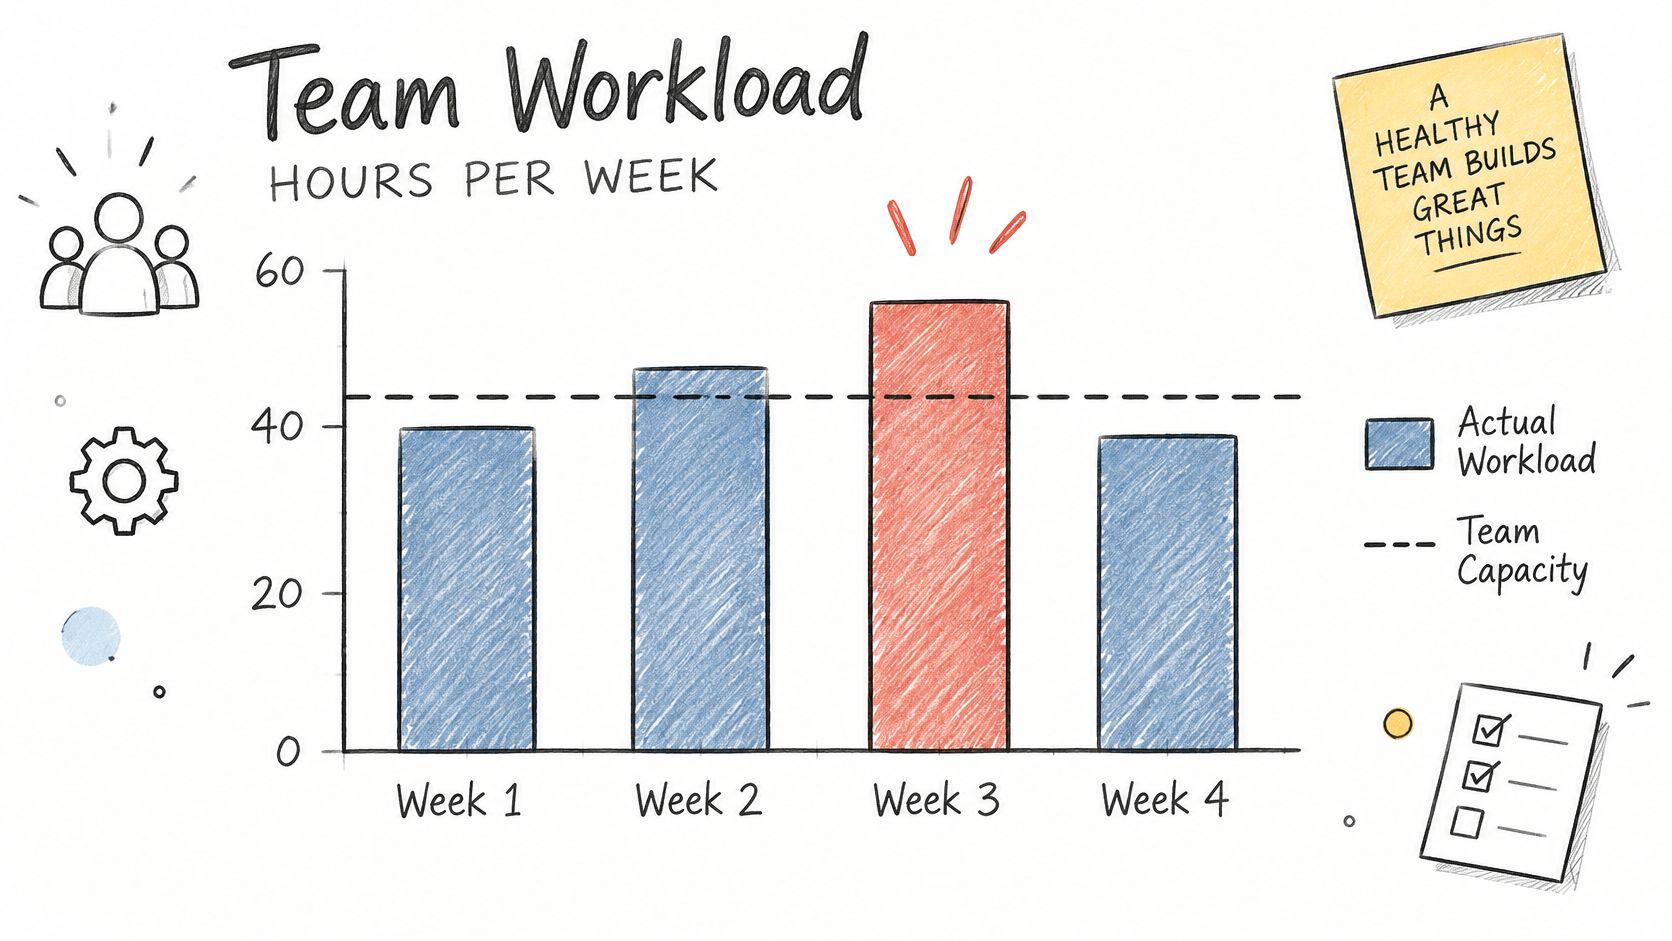
Healthy versus warning
- Healthy: items written as outcomes (launch, approval, handover), dates labeled as target or committed, and every milestone linked to a project with real tasks underneath.
- Warning: roadmap items that are really task lists in disguise, every date presented as a commitment, and nothing on the roadmap connected to work anyone is doing.
Comprehension is a measurement problem, not a design nicety. Guidance on data products recommends building accessibility in during planning, documenting limitations, testing conformance and providing an alternative access pathway, as a research guide from the Washington State Board for Community and Technical Colleges sets out. In practice that means every roadmap ships with a short written summary of what changed since the last update, what's blocked, and what a color can't communicate on its own.
Treat the roadmap as the top level of a working plan, not a separate document. A project implementation plan that carries phases, owners and dates can feed the roadmap view directly, so the summary and the detail never drift apart.
Project Management Graphs at a Glance
| Graph / Chart | What It Shows | Best For | Key Limitation |
|---|---|---|---|
| Gantt Chart | Tasks, durations, dependencies, and milestones on a calendar timeline | Planning and communicating schedules for fixed-scope projects | Can become cluttered and difficult to maintain on large or frequently changing projects |
| Kanban Board | Work items moving through workflow stages, with work in progress visible | Managing continuous work and spotting workflow bottlenecks | Deadlines and dependencies are not clear unless tracked separately |
| Burndown Chart | Remaining work over time compared with an ideal progress line | Tracking whether a time-boxed sprint or release is on schedule | Scope changes and inconsistent estimates can distort the picture |
| Burnup Chart | Completed work and total scope over time | Tracking progress when project scope changes frequently | Requires maintaining a separate scope line and can be harder to interpret |
| Cumulative Flow Diagram | Work-item counts across workflow stages over time | Diagnosing bottlenecks and monitoring Kanban flow | Requires consistent stage definitions and takes practice to interpret |
| PERT and Critical Path Network Diagram | Activity dependencies, timing estimates, slack, and the critical path | Managing complex projects with interdependent tasks and schedule risks | Can be complex to build and depends on accurate estimates and dependencies |
| Resource Workload Histogram | Assigned hours or tasks over time compared with available capacity | Identifying over- or underallocation and balancing team workload | Depends on accurate, up-to-date assignments and estimates |
| Project Roadmap Timeline | High-level goals, phases, and milestones across months or quarters | Communicating direction, priorities, and major dates | Too high-level for daily work and requires a separate detailed plan |
Choosing Your Charts and Putting Them to Work
Tool adoption is no longer the bottleneck. BuiltWorlds reported in its 2024 Annual Project Management & Oversight Benchmarking Report that 70% of survey respondents used a project-management solution on every project in 2024. Nearly everyone has the software. Still, many users can't tell you what last week's chart meant.
The better question isn't which graph is most useful. As a comparison of project management charts puts it, the stronger principle is "the smallest visual that answers a specific decision question using trustworthy, current data." A schedule that encodes guesses in three decimal places isn't more rigorous than a rough trend line. It's just harder to argue with.
Match the chart to the question you're holding:
- Scheduling: Gantt for sequencing and stakeholder deadlines, critical path and PERT when dependencies determine the finish date.
- Flow: Kanban for daily execution, cumulative flow for diagnosing where the process constrains itself.
- Scope and sprint health: burndown for a fixed time box, burnup the moment scope starts moving.
- Capacity: workload histograms, updated from logged time rather than hope.
- Communication: a roadmap for clients and executives, always paired with a written summary.
Pick the two or three views that address your biggest current risk and put them on a fixed cadence. Monday for capacity, daily at standup for the sprint line, monthly for flow and roadmap. Write down the decision each chart is meant to trigger, and retire any chart nobody has acted on in a month.
Tuff supports the whole loop in one workspace. Projects hold their tasks, chat, docs and announcements together, tasks switch between List and Board views at the top of the Tasks screen, time is logged on the work itself with the team's time shown in stats, and there's no cap on projects or tasks. That matters more than it sounds: the graphs above only work when the data behind them lives where the team already works, not in a reporting layer someone updates on Fridays.
The point of a project management graph was never the chart. It's the sentence you say in the meeting after you've read it.
When your schedule, your board, your time logs and your client conversations all live in the same place, reading a chart stops being a research project. Tuff keeps projects, tasks, chat, docs and time tracking in one workspace, with unlimited projects and tasks, so the data behind your Gantt, your board and your workload view is the same data your team is already working in. Visit Tuff and start with a project, then add the two or three views that answer your riskiest question.